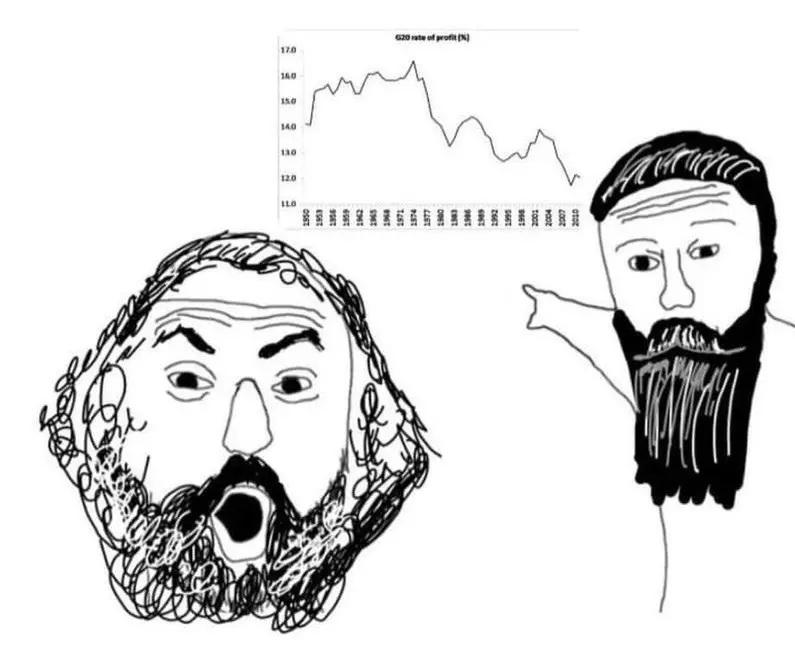
This comes from this data: https://www.rug.nl/ggdc/productivity/pwt/?lang=en
This specific chart comes from page 29 of this, which uses the above data: https://scholarworks.umass.edu/server/api/core/bitstreams/69ff54a4-6554-48b9-9b5b-58008cb25725/content
True, but a measure of uncertainty would be nice to see as well. Anything anti-capitalist will be held to a higher standard so we should be in the habit of including errorbars, for example.

I love this graph, it is an excellent graph
1960 - 2020 chart, it's the most up to date one I've seen.
Link?
This comes from this data: https://www.rug.nl/ggdc/productivity/pwt/?lang=en
This specific chart comes from page 29 of this, which uses the above data: https://scholarworks.umass.edu/server/api/core/bitstreams/69ff54a4-6554-48b9-9b5b-58008cb25725/content
Ayo not starting at zero >:(
Completely fine as long as the axes are clearly marked and consistently spaced
True, but a measure of uncertainty would be nice to see as well. Anything anti-capitalist will be held to a higher standard so we should be in the habit of including errorbars, for example.
so thats why the empire wants war so bad with literally anyone else