

https://twitter.com/wsbgnl/status/1776748045977489508/photo/1
Thanks @sovietknuckles@hexbear.net for an explanation of how to get to the data:
Direct link (from https://www.cdc.gov/surveillance/resp-net/dashboard.html)
To get the same visualization in the screenshot:
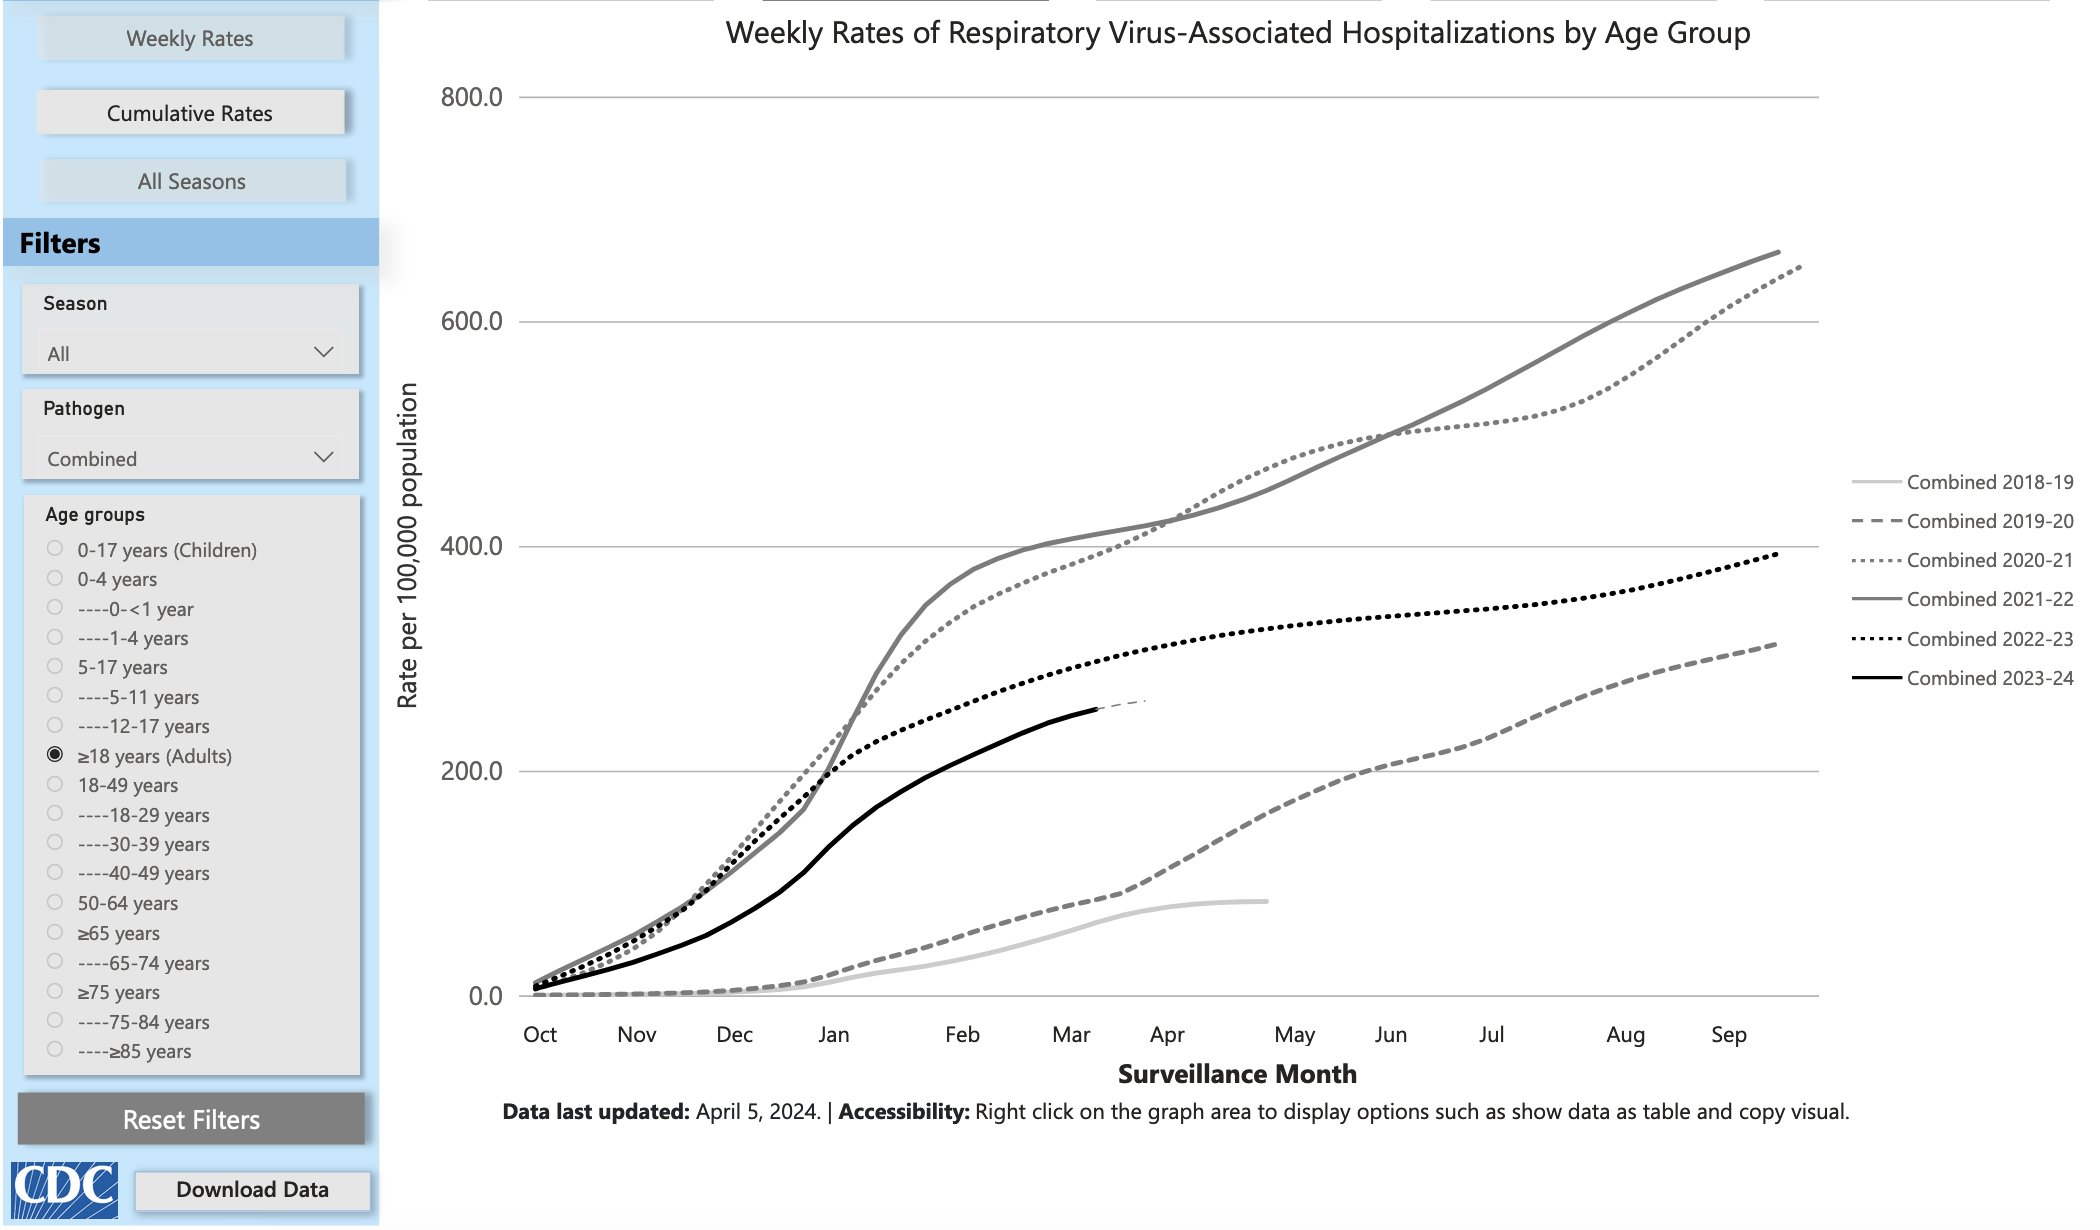
- Change Weely Rates to Cumulative Rates
- Change season to Select all
- Change pathogen to Combined only
Direct link (from https://www.cdc.gov/surveillance/resp-net/dashboard.html)
To get the same visualization in the screenshot: