I'm not good at math, but people keep passing this chart around in reddit-logo

Show

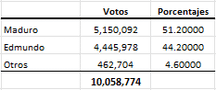
But I keep seeing people in the comments debating whether this is actually "impossible" or not, using stats terms I'm not familiar with. Also idk the source of this graph so maybe it's bs.

  • usa_suxxx [they/them]
    ·
    edit-2
    2 months ago

    Yea, I get there are no fractions of votes. Why would you need 5 significant numbers? Isn't the Election just plurality? Straight up most votes wins. The percentages are just to make communication easier.

    Using percentages from the total yields:

    10,058,774 * 51.20% = 5,150,092.288
    
    10,058,774 * 44.20% = 4,445,978.108
    
    10,058,774 * 4.60%  =   462,703.604
    

    And what you're saying yields:

    5150092 / 10058774 = 51.1999971368%
    
    4445978 / 10058774 = 44.1999989263%
    
    462704 / 10058774  =  4.6000039369%
    

    Like, there isn't really a way to do tell which the numbers come from...but the behavior they show is literally the default behavior in LibreOffice Calc when you use the % Format with 5 significant digits. It also functions that way in Google Sheets in Google Sheets with 5 significant digits. Its a software thing. Software does really weird stuff with percentages. I tried it in both just now. Plugin it and you'll get the exact same numbers.

    edit: Excel does the same for the 5,150,092 percentage and 4,445,978 percentage except 452,704 shows 4.50059%. Software is weird

    Google Sheets

    Show

    LibreOffice Calc

    Show

    I don't have Excel on my personal computer

    • Vampire [any]
      ·
      2 months ago

      Honestly if you don't get it by now I can't explain any more