

You must log in or register to comment.
And the best part in this is that it all aligns with the Mandelbrot set, for some reason
Edit: Nevermind, it's the bifurcation diagram of the Mandelbrot set that does this.
Show Show
Show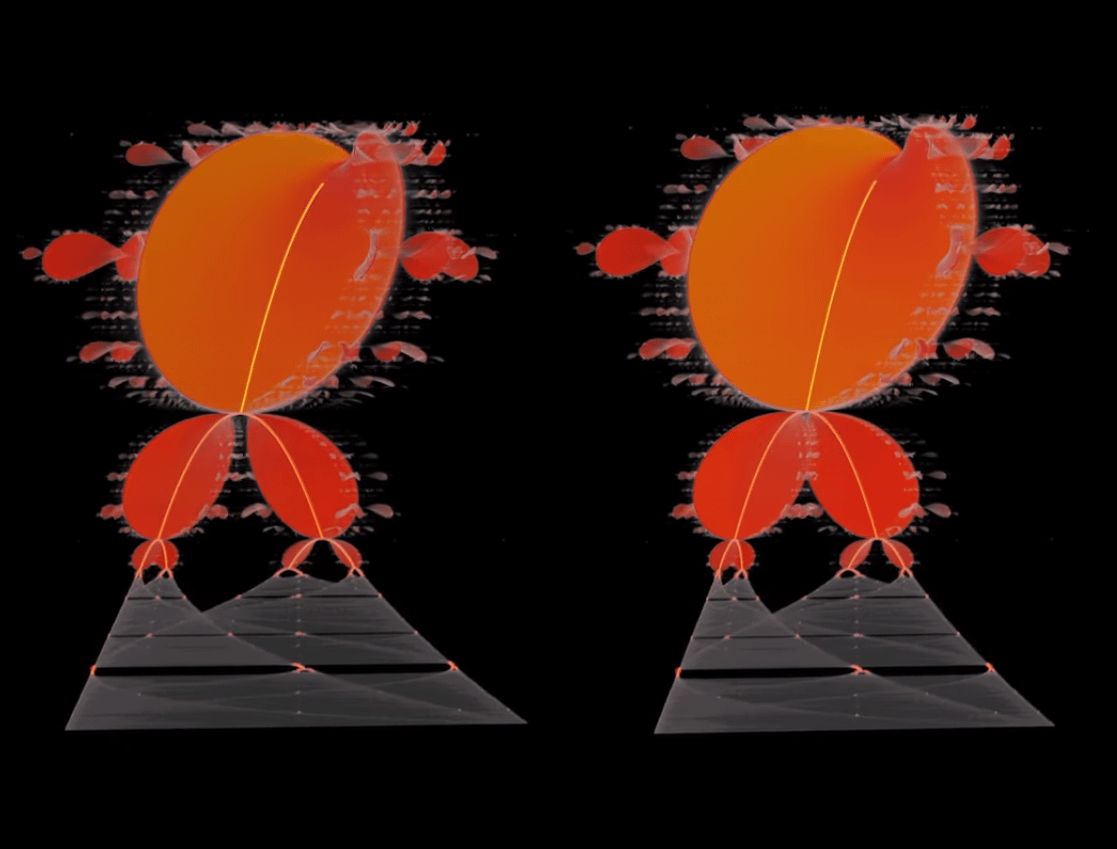
It doesn't, the one that aligns is the bifurcation diagram of the function used to make the set (f(z)=z^2+c), which is different from the rabbit one (the logistic map, f(x)=rx(1-x)).
As so often with anything related to maths, pi pops out at the most unexpected places.