This might be something we find useful. It looks at the 50 newest submissions, gathers all the users in the comments + the poster, and then scans their profiles for their other posts and comments, then tallies the Subreddits they're interacting with.
What you get out of it is a list of Subreddits and the number of interactions with that Subreddit, based on a given Subreddits userbase. You end up with a kind of web of interaction.
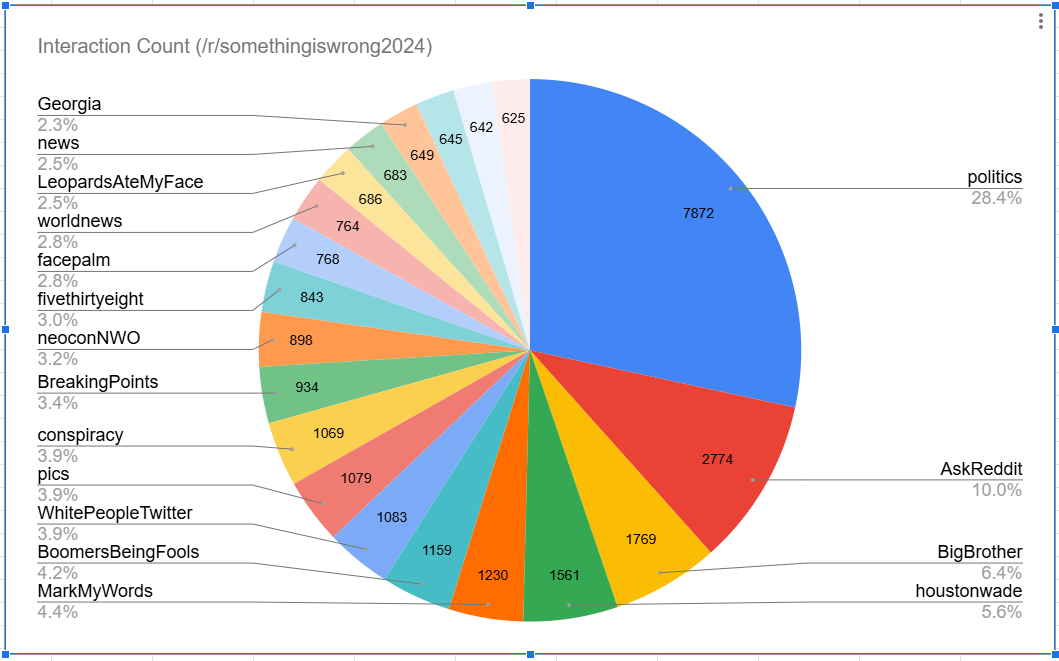
Here is a pie chart showing the subreddits that users of /r/somethingiswrong2024 who interact with the top 50 posts in the sub also interact with.

The percentages on this graph are not representative of the interactions across the whole of the data, but only representative of the percentage against the whole of the top 20 subreddits by interaction. So r/politics might say 28%, it doesn't represent 28% of ALL interactions, just 28% of the top 20 interactions.
If you ran this script, say, once a week, and logged the files, you could probably graph the changing interactions over time.
There is most likely a way you could collect this data that would result in a kind of interaction web.
I'm not sure that fetching New threads of Top threads would offer clearer results. I feel like New threads get you the most active people.
Likewise, I'm also interested in maybe cooking up a couple of scripts based on this code that could show you the Power Posters in a given sub (people with the most comments/posts with the highest engagement), generate a heat map of the active days of the week / active times of the day for a given sub.
A Reddit link was detected in your post. Here are links to the same location on alternative frontends that protect your privacy.
I fear that in tinkering with this script, I have made it too efficient. I keep running up against reddit's rate limit.
