

- cross-posted to:
- personalfinance@lemmy.ml
- latestageusempire@lemmygrad.ml
- cross-posted to:
- personalfinance@lemmy.ml
- latestageusempire@lemmygrad.ml
cross-posted from: https://lemmygrad.ml/post/4277310
The craziness of the US stock Market
You must log in or register to comment.
Noticing something with the distribution of years starting with 1 and 2
- Show
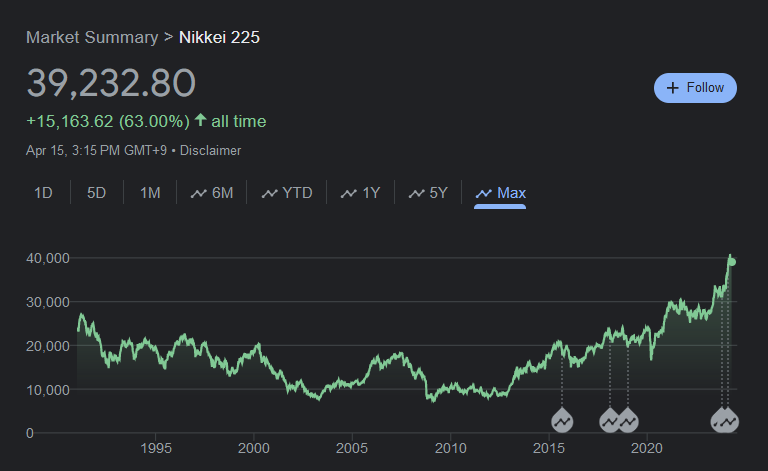
It's been on a tear over the last 15 years. But I agree, not exactly a steady rate of return over its lifetime.
That's a really weird looking distribution because of the weird breaks. 0 to 8% is an 8% range, 8 to 12% is 4%, 12 to 20% is an 8% range again. This is what a real histogram looks like:
Show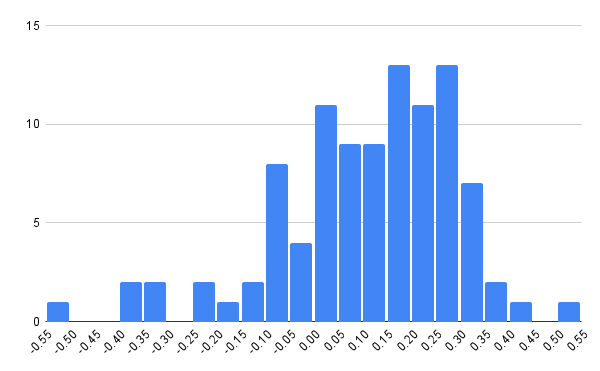
Here's the same grouped by month:
Show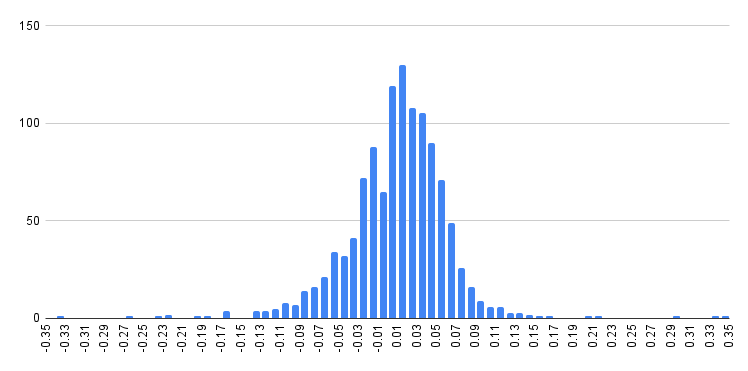

I found a YouTube link in your comment. Here are links to the same video on alternative frontends that protect your privacy:


