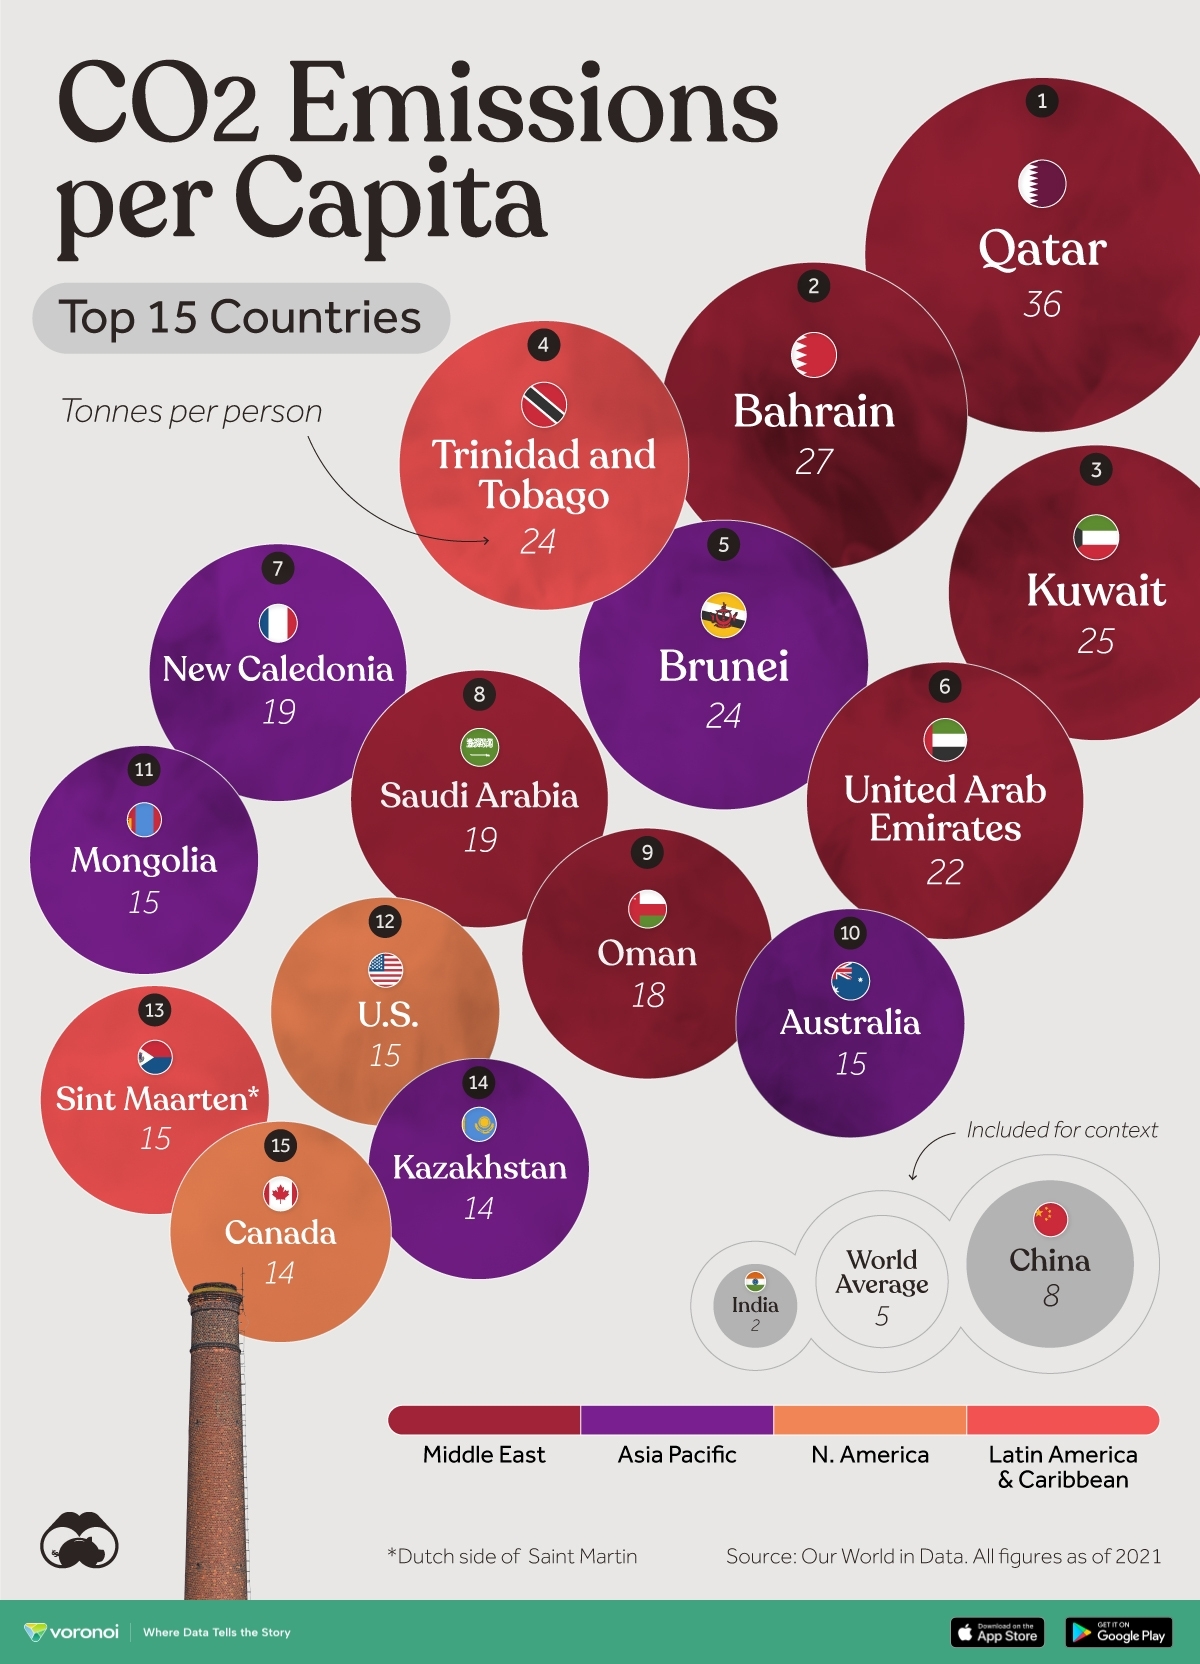
exact opposite actually https://ourworldindata.org/grapher/consumption-co2-per-capita?tab=table&time=2019..2021 China is the #1 stuff exported so their emissions go down a bit (not too much cuz they also import a lot) while small poor oil producers drop way down, and imperial core countries go up because they import more than they export in general.
That’s only consumption metrics. That is the exact same as this graph. Did you read the header of the graph you chose? It also excludes exports and traded goods.
While they are consumed elsewhere, China still profits off of those produced goods. Do you think that the emissions from those factories aren’t concentrated?
They do, but the out sourcing isn't what produces the carbon emissions, its the production itself.
Is it immoral, yes. Is it unethical and a way to push the problem onto someone else? Yes. Does China still profit off of it, also yes. But the production is the source of the emissions, not some corporate entity.
I'm confused. I clicked on flamingoats Link and got a different set of data than was used for the graph above. What link did you see?
...
Right in the middle of this, I think I realized that what you were saying is that the original post did not take into account trade at all, whereas Flamingoats Link did take into account trade and China was lowered. So are you saying that the two pieces of data align and if you were not taking away emissions from trade, then China would be higher?
Because if that is true, then isn't it more genuine to show the emissions that the citizens actually use? Because the emissions of Western countries are much higher because they're exporting their manufacturing.
That’s the exact same graph, read the header above it. That’s only consumption metrics and they are not counting the production of goods for export. I was referring the total emissions, which would include the production of goods and services.


This doesn’t account for trade goods. China should be much higher and absolutely within the top 15 if you accounted for traded goods.
exact opposite actually https://ourworldindata.org/grapher/consumption-co2-per-capita?tab=table&time=2019..2021 China is the #1 stuff exported so their emissions go down a bit (not too much cuz they also import a lot) while small poor oil producers drop way down, and imperial core countries go up because they import more than they export in general.
That’s only consumption metrics. That is the exact same as this graph. Did you read the header of the graph you chose? It also excludes exports and traded goods.
While they are consumed elsewhere, China still profits off of those produced goods. Do you think that the emissions from those factories aren’t concentrated?
Now factor in Western companies who outsource their manufacturing to China and maintain higher profit margins than the factories themselves.
They do, but the out sourcing isn't what produces the carbon emissions, its the production itself.
Is it immoral, yes. Is it unethical and a way to push the problem onto someone else? Yes. Does China still profit off of it, also yes. But the production is the source of the emissions, not some corporate entity.
I'm confused. I clicked on flamingoats Link and got a different set of data than was used for the graph above. What link did you see?
...
Right in the middle of this, I think I realized that what you were saying is that the original post did not take into account trade at all, whereas Flamingoats Link did take into account trade and China was lowered. So are you saying that the two pieces of data align and if you were not taking away emissions from trade, then China would be higher?
Because if that is true, then isn't it more genuine to show the emissions that the citizens actually use? Because the emissions of Western countries are much higher because they're exporting their manufacturing.
That makes a lot more sense - thanks
it doesnt, china is an overall exporter so they go down
https://ourworldindata.org/grapher/consumption-co2-per-capita?time=latest
That’s the exact same graph, read the header above it. That’s only consumption metrics and they are not counting the production of goods for export. I was referring the total emissions, which would include the production of goods and services.
All good! No worries! By extension the US should also be much higher!