

- cross-posted to:
- worldnews@lemmy.ml
- cross-posted to:
- worldnews@lemmy.ml
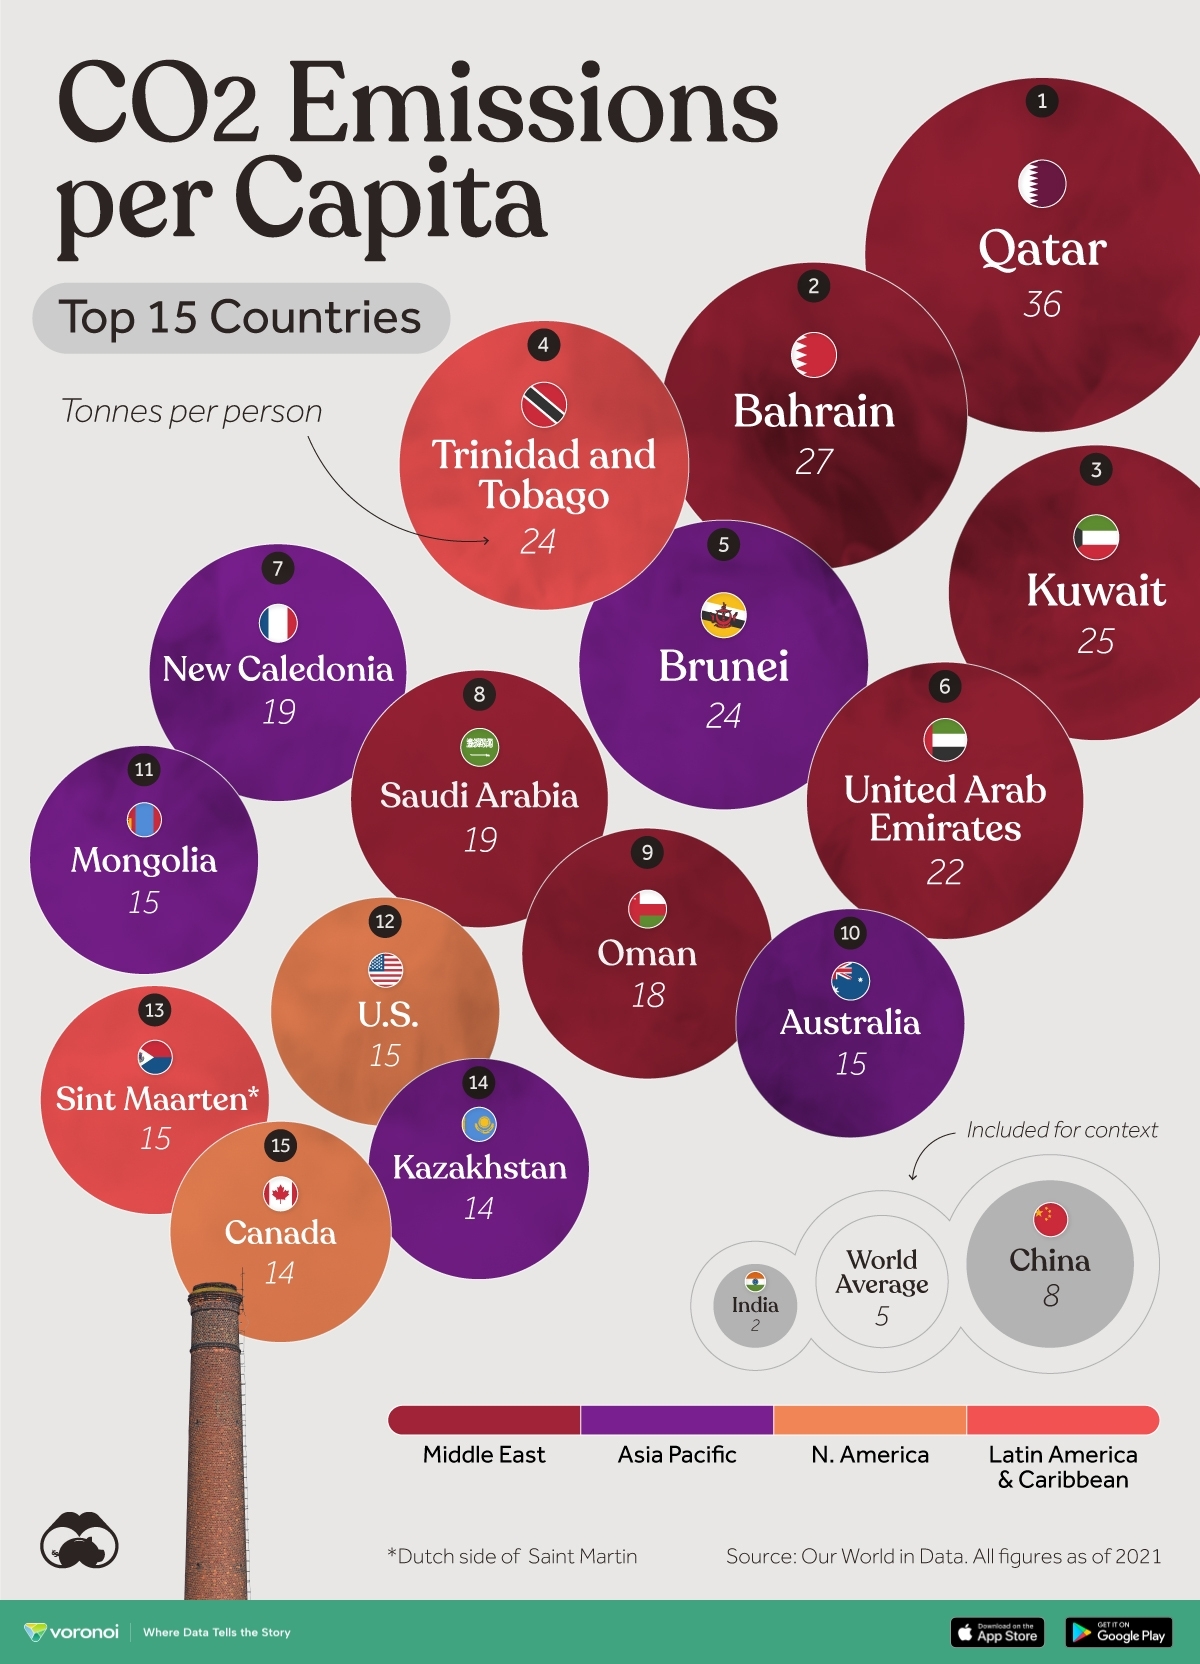
source https://www.visualcapitalist.com/ranked-per-capita-carbon-emissions-by-country/
You must log in or register to comment.
This data is based on territorial emissions, which do not account for emissions embedded in traded goods.
Is there a source that accounts for this? Because IMO the data is useless unless this is factored in.
Also it's nuts that Canada is able to sneak in here. I'm guessing they rely too much on fossil fuels for energy is my guess.
For sure, I've seen metrics before where they account for total cost of emissions based on consumption. I do think that's a more useful metric overall because at the end of the day it doesn't matter where emissions happen, the demand for goods is what's driving the emissions. So, if we want to reduce emissions meaningfully, we need to cut consumption. Focusing on domestic emissions also allows for games such as one Europe is playing where they're just outsourcing all their industry and then claiming to have cut emissions.
https://ourworldindata.org/grapher/consumption-co2-per-capita?time=latest
same source actually
As someone who’s from Arabia a few points:
- Desalination and cooling are the major factors for our high energy consumption
- The US still refuses allowing us to make use of uranium
- Photovoltaic doesn’t work when it’s regularly over 40C and there have been one infamous case of the panels melting
Sounds like uranium problem might now be solved with help from Russia, and an alternative to photovoltaic solar power would be to use mirrors to heat up molten salt the way China is doing with some of their plants http://www.xinhuanet.com/english/2021-03/01/c_139775005.htm
Saudi Arabia is building the world’s largest solar thermal plant and has been negotiating civilian nuclear development with China.
Good stuff, I expect a lot of positive development will come out of partnering with China and Russia in the near future.
I like how China isn't even near the top despite producing all the shit for these countries.Edit: ComradeSalad is smart and actually reads things :)
This doesn’t account for trades goods. China should be much higher and absolutely within the top 15 if you accounted for traded goods.
This doesn’t account for trade goods. China should be much higher and absolutely within the top 15 if you accounted for traded goods.
exact opposite actually https://ourworldindata.org/grapher/consumption-co2-per-capita?tab=table&time=2019..2021 China is the #1 stuff exported so their emissions go down a bit (not too much cuz they also import a lot) while small poor oil producers drop way down, and imperial core countries go up because they import more than they export in general.
That’s only consumption metrics. That is the exact same as this graph. Did you read the header of the graph you chose? It also excludes exports and traded goods.
While they are consumed elsewhere, China still profits off of those produced goods. Do you think that the emissions from those factories aren’t concentrated?
Now factor in Western companies who outsource their manufacturing to China and maintain higher profit margins than the factories themselves.
They do, but the out sourcing isn't what produces the carbon emissions, its the production itself.
Is it immoral, yes. Is it unethical and a way to push the problem onto someone else? Yes. Does China still profit off of it, also yes. But the production is the source of the emissions, not some corporate entity.
I'm confused. I clicked on flamingoats Link and got a different set of data than was used for the graph above. What link did you see?
...
Right in the middle of this, I think I realized that what you were saying is that the original post did not take into account trade at all, whereas Flamingoats Link did take into account trade and China was lowered. So are you saying that the two pieces of data align and if you were not taking away emissions from trade, then China would be higher?
Because if that is true, then isn't it more genuine to show the emissions that the citizens actually use? Because the emissions of Western countries are much higher because they're exporting their manufacturing.
it doesnt, china is an overall exporter so they go down
https://ourworldindata.org/grapher/consumption-co2-per-capita?time=latest
That’s the exact same graph, read the header above it. That’s only consumption metrics and they are not counting the production of goods for export. I was referring the total emissions, which would include the production of goods and services.
All good! No worries! By extension the US should also be much higher!
i can't stop being skeptical off these studies.
how does it work when international institutions are involved? many polluting processes are outsourced to the global south because its cheaper, but the profits go to the global north, who is getting the emissions debt in these cases? what about financial debts paid with the profits of polluting processes?
i feel like these studies will never paint the real picture because it tries to isolate carbon emissions per country without taking in mind the relations of production. for example trinidad y tobago, without knowing anything about the country i can bet that whatever industry they have (i bet its energy) is primarily owned by foreign companies and thus they are profiting off that but trinidad y tobago assumes the emissions debt as we see here.
I agree, but even when a lot of emissions externalized, western countries are looking pretty terrible while China's emissions per capita are pretty low. Given that China is a major industrial power, that's quite an achievement.
I don't know if you saw the other responses below, but this data does not take into account trade, either imported or exported, but other sources people have linked to does take into account trade, and actually might be more interesting, and more accurate, results.
someone needs to take the mantle of visualmarxist, im sick of this twat (these twats?)
haha totally, they make good charts, but it always hurts me inside to link to them :)
Big tourist industry, major port, with small local population = each local "takes on" the tonnage that came from several tourists + cruise ships and shipping in general.
That's my guess anyway, because a similar thing is going on in my country with water consumption.
Fuck cruise ships. They do nothing but pollute, and have no actual use
They mix petrochemicals and other raw materials from other nations.
Oil smoothies ain’t good.
Bruh wtf is Trinidad and Tobago doing to be up there with the gulf oil states?
Same thing - their economy is entirely based on petroleum extraction and processing.


