

The most baffling thing to me about modern data visualizations is that they're almost exclusively consumed on devices that support interactive media. We don't have to use these contrived non-interactive charts that make everything extremely cluttered and confusing. We can animate things, we can show slices of things, we can allow the user to hide/show/filter data within the bounds of what we're trying to highlight/present. Not everything has to be made to be able to be consumed on a piece of paper.
Sorry some personal work visualization complaints got meshed into that rant.
Just because they could doesn't mean they should.
I seriously think about that quote all the time when it comes to the digital world. It is great that digital stuff is so easy, simple, and insanely cheap but there's no "gravity" so people make (totally) ridiculous castles in the air, massively overshare, etc. I'm polite to people but I go way out of my way to lie a little and say I'm not on social media at all. If needed - I thrown in a little rant. I'm sorry - I avoid the social media panopticonm Cousin Tom. And I'm sorry but I can't look at your 852 photos of your family's trip to the Grand Canyon. And there's video too? I almost wish I was on social media!
I'd be willing to go up to 10 (maybe 20?) of the best photos but that's it. My life span is not 1,000 years and I've got cat vids to watch.
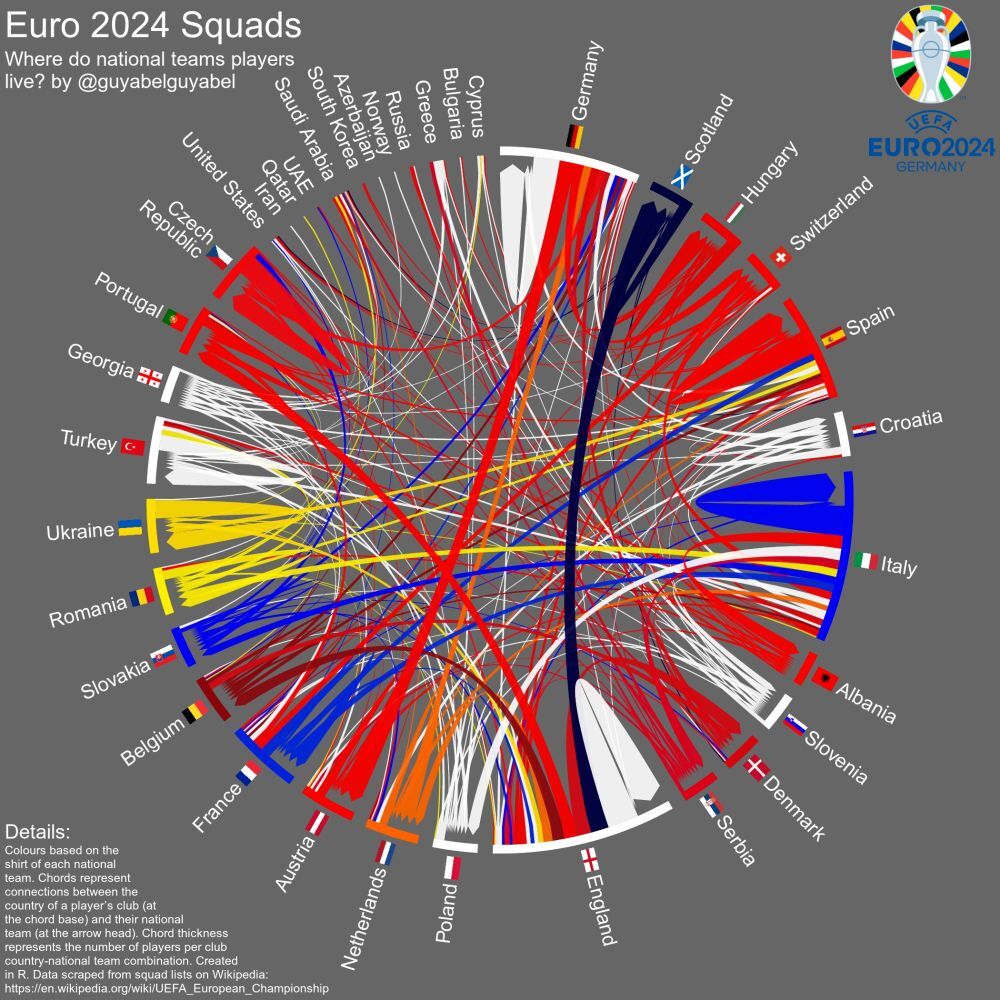
thanks for making a clearer picture, i couldn't understand the other one for shit
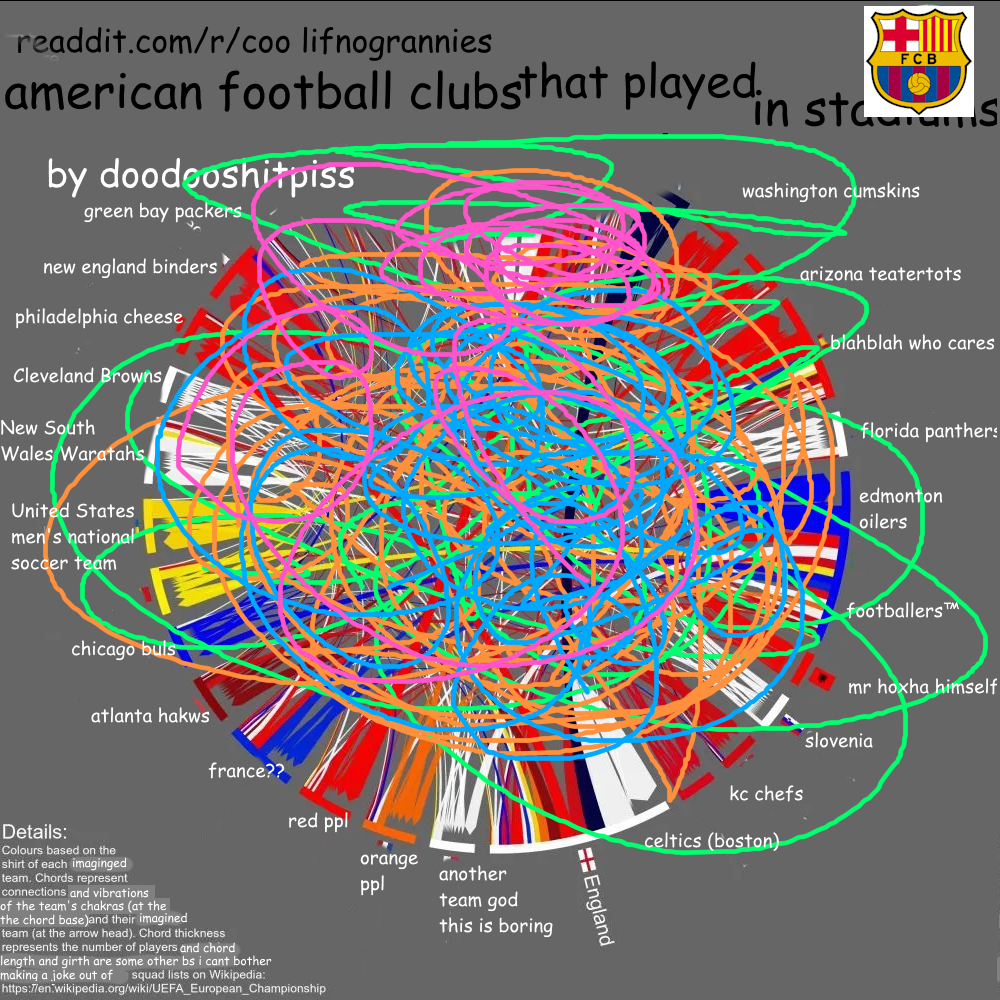
Weird - why do SO MANY Philadelphia Cheese players live in Mr Hoxha Himself
I replied with this to the OP...
I feel like a dinosaur but I have to admit when I look at infographic like that it makes me think it's super-detailed cooked spaghetti conceptual art.
But then I deleted it a few minutes later. I thought the graphic was from Reddit or something. But he had made it himself.
i feel like this could've been easily accomplished with a stacked bar chart for each country and a better title


